
I am a data science student based in Mumbai with a passion for turning raw data into decisions that matter. Though early in my career, I have already built real-world analytics projects spanning telecom churn modelling, e-commerce retention analysis, marketing attribution, and food delivery operations — each grounded in SQL, Python, and Power BI. I am currently pursuing my B.Sc. in Data Science at KES Shroff College and hold certifications from Google and AWS. I build things, break them down, and figure out what the numbers are really saying. Lets connect.
I am Srinith Samala, a third-year B.Sc. Data Science student at KES Shroff College, Mumbai, building my analytics career through hands-on project work and continuous learning. I work across the full analytics stack writing SQL with CTEs and window functions, building Power BI dashboards with DAX, and using Python for data wrangling and NLP. My projects are self-initiated and built on real datasets, not toy examples, covering telecom churn, e-commerce revenue volatility, marketing mix attribution, and food delivery operations. I have completed virtual programmes with Deloitte, British Airways, and Tata Group to get exposure to how analytics works inside large organisations. I am actively looking for my first full-time data analyst role where I can bring this foundation and grow fast.
Hover to reveal
To land my first data analyst role and deliver real business impact through rigorous, insight-driven analysis from day one.
Hover to reveal
To grow into a senior data analyst and eventually a data scientist who shapes strategy through analytics at scale.
KES' Shroff College, Mumbai, India
Self-initiated analytics projects on real datasets — not toy examples.
A full-funnel SQL and Power BI analysis of telecom customer contracts to quantify churn-driven revenue risk. Identified that month-to-month customers concentrate ~47% of total revenue at risk. A contract migration strategy was modelled and recommended.
Identified the primary driver of churn-driven revenue risk through contract-type segmentation in SQL
Quantified ~47% of total revenue concentrated in high-risk month-to-month customer segments
Estimated protection of ~£200K annual revenue under a conservative contract migration scenario
Built an executive Power BI dashboard translating SQL findings into strategic recommendations
A marketing analytics project comparing last-touch vs. linear attribution models to expose channel overvaluation and bias. A what-if budget simulation was built to model revenue impact of reallocation decisions, revealing the scalability limits of high-ROI channels.
Identified attribution bias showing overvaluation of closing channels under last-touch models
Designed a what-if budget simulation that exposed ~21% revenue loss risk from ROI-only reallocation
Demonstrated high-ROI channel scalability ceiling and recommended a hybrid reallocation strategy
Delivered strategic recommendations bridging marketing efficiency and revenue stability
A large-scale SQL analysis of 541K+ e-commerce transactions to diagnose revenue volatility, customer churn, and product-level retention patterns. Revealed structural instability in the revenue base driven by high churn and top-customer concentration.
Analysed 541,000+ transactions using advanced SQL (CTEs, window functions) for cohort and retention diagnosis
Identified 51% customer churn rate as the core driver of monthly revenue swings between £400K–£1.1M
Pinpointed top 10% customer revenue concentration as a key structural risk factor
Produced actionable retention and diversification recommendations grounded in transaction-level evidence
A multi-table SQL analysis of a food delivery platform covering customers, restaurants, orders, and item-level data. Answered 10 structured business questions across three difficulty tiers — from basic aggregations to advanced window-function-based rankings — paired with an interactive Power BI dashboard.
Segmented customers into Premium, Gold, and Regular tiers using CASE WHEN spend classification
Ranked top 3 restaurants per city by revenue using RANK() OVER window functions
Identified high-frequency customers (5+ orders) to surface loyalty and repeat-purchase patterns
Built a Power BI dashboard with KPIs for Total Revenue, Orders, Customers, and AOV with city/restaurant slicers
The languages, tools, methods, and soft skills I use to turn data into business decisions.
Industry-recognised certifications validating my technical and analytical expertise.
Building a track record of applied analytics impact — one project, one insight, one decision at a time.
Deloitte / Forage
Data Analytics virtual internship; built Power BI dashboards simulating real client engagement.
British Airways / Forage
Data Science virtual internship; built NLP sentiment pipeline using Python.
Tata Group / Forage
Data Visualisation virtual internship; designed executive-ready strategic visuals.
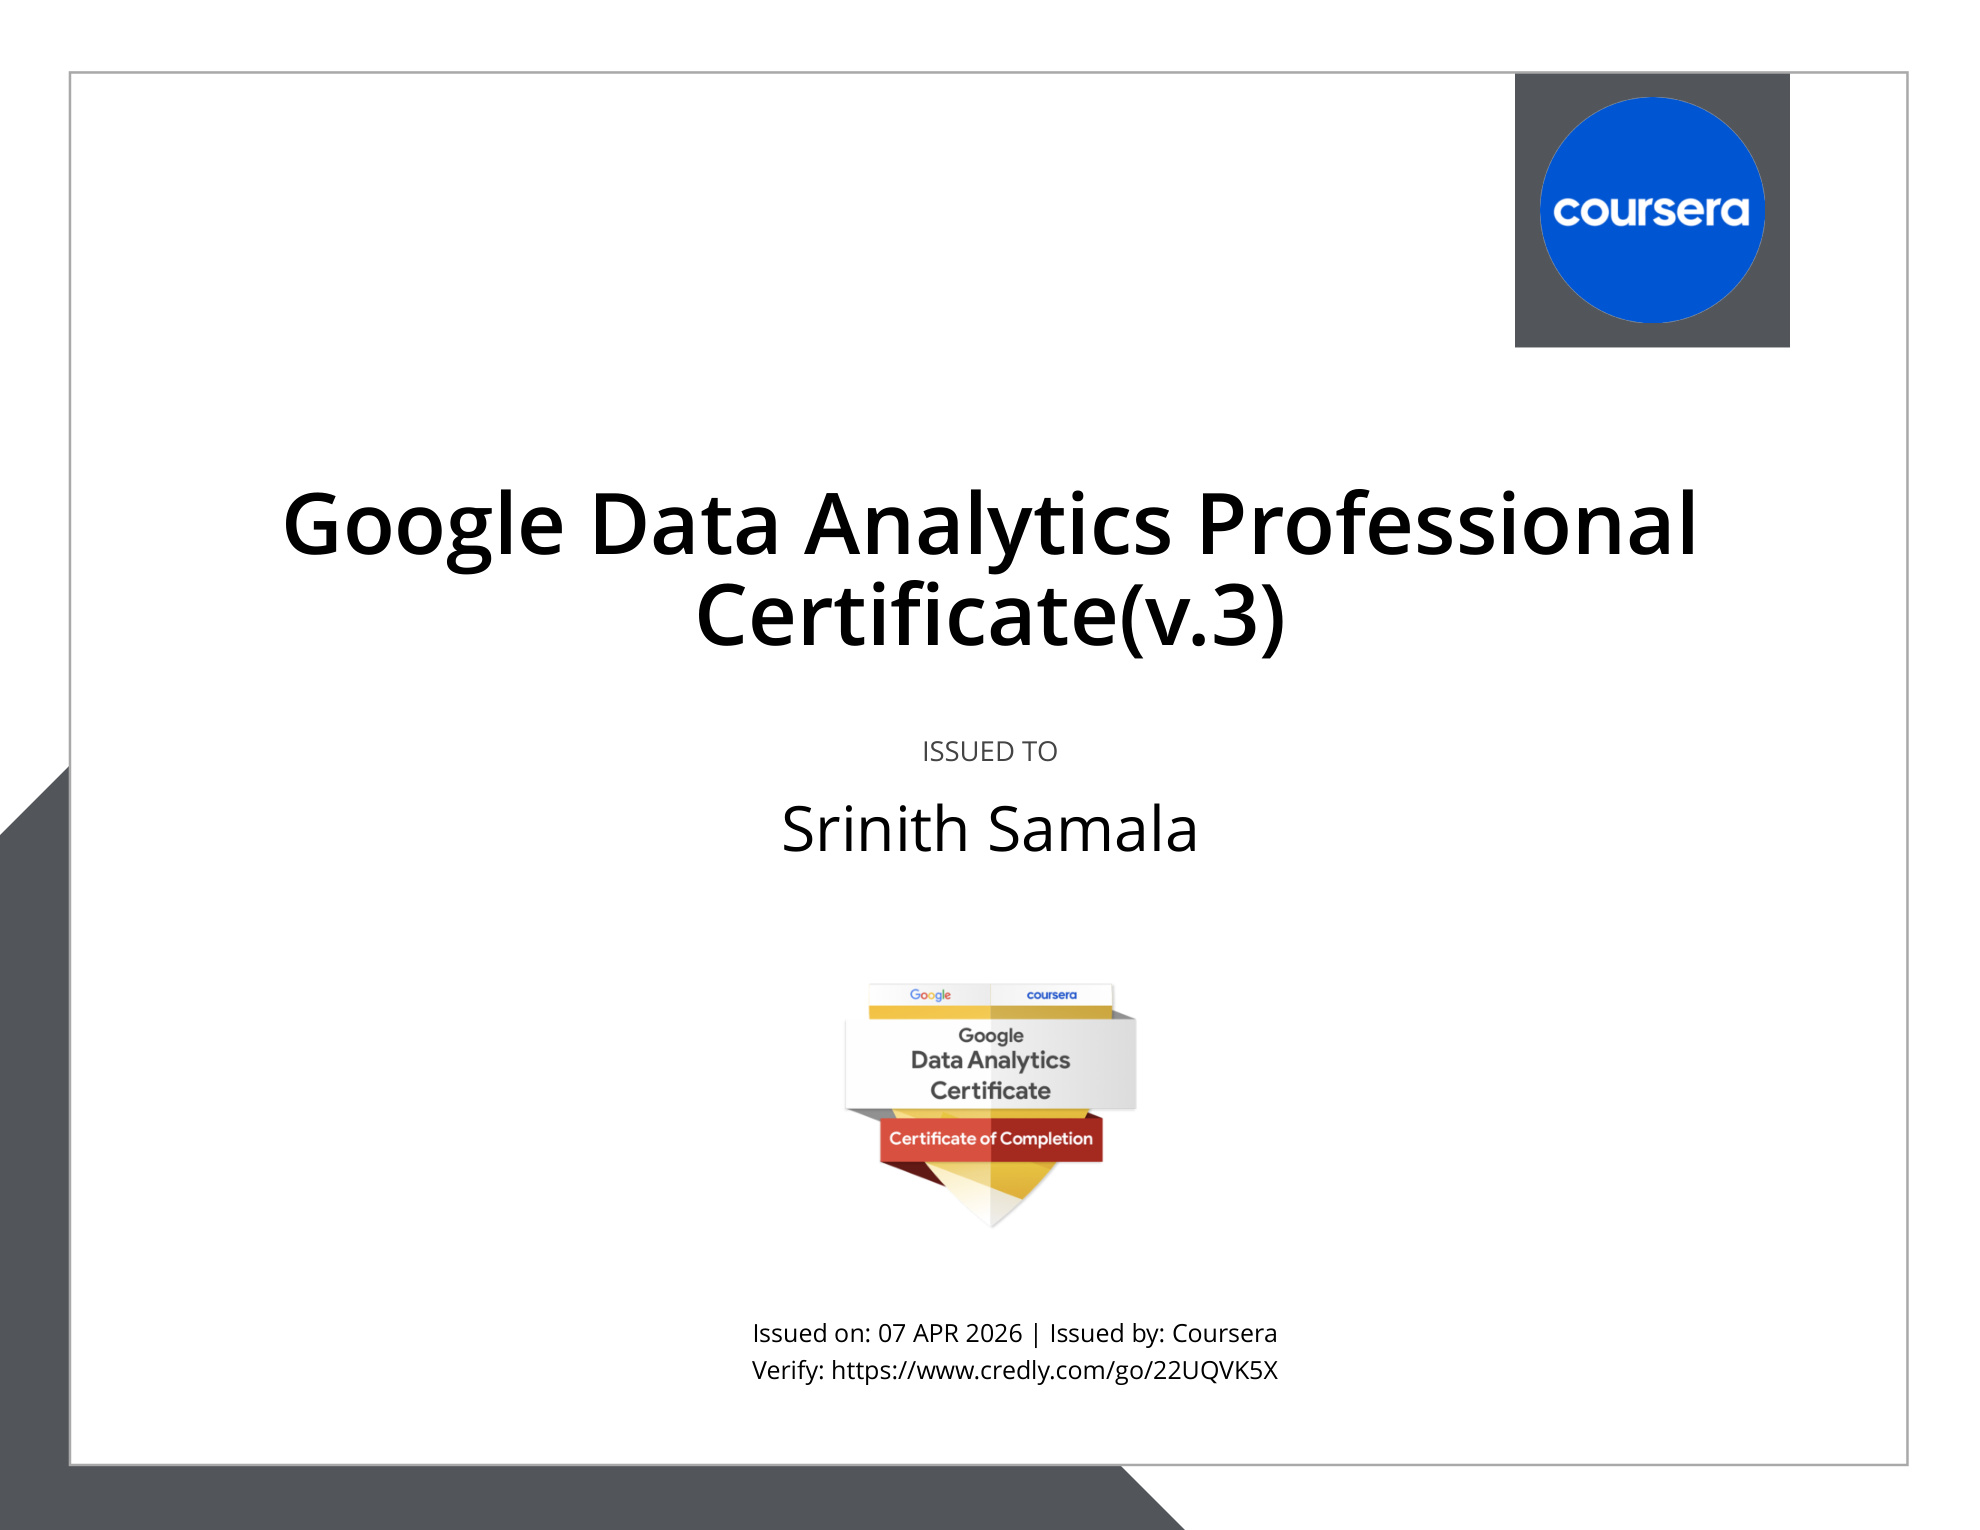
Google / Coursera
Earned Google's industry-recognised data analytics certification validating end-to-end analytics proficiency.
Amazon Web Services / Coursera
Completed AWS foundational cloud certification, extending technical versatility into cloud-native environments.